
Pharma news · Critical appraisal · 18 October 2026
Satralizumab and SatraGO: one significant trial and one non-significant trial—what can we conclude?
The regulatory announcement is an opportunity to look beyond the p value: which effect was estimated, how uncertain is it, and which assumptions would we carry into the next trial?
The short answer: different significance labels do not establish that treatment effects differ between studies. They do not establish equivalence either. Interpreting the evidence requires the estimates, their intervals and the design that gives them meaning.
Open the practical guide and reproduce scenarios in Trial Planner and R
1. What happened, and what is new?
On 16 October, Roche announced US approval of Enspryng, satralizumab, for adults with thyroid eye disease. Genentech had issued its US announcement on 15 October. Those announcements provide the current news hook; their dates should be distinguished from the dates of the underlying evidence. The week-24 SatraGO-1 and SatraGO-2 results were published online on 7 September 2026, following earlier presentations of results. Roche · Genentech · Scientific publication.
The statistical interest lies in two similarly designed studies whose results fall on different sides of a significance threshold. Approval is a regulatory decision. Our purpose is to explain how to read the trials and translate their questions into a future research design. We do not reconstruct the agency's complete assessment or attribute the entire decision to a single statistical test.
2. What was compared, and which question was asked?
SatraGO-1 and SatraGO-2 are phase III, multicentre, randomized, masked, placebo-controlled trials. They enrolled 131 and 127 participants, respectively, with active or inactive disease. The primary outcome concerned participants with active disease: proptosis response at week 24. Response required a reduction of at least 2 mm in the study eye without worsening of at least 2 mm in the other eye. The randomized unit was the person; having two eyes does not double the independent sample size. Article · Investigator presentation, slide 7.
A binary response converts a continuous measurement into a decision: whether a prespecified rule is satisfied. The individual 2-mm threshold and the between-group difference in response proportions are different quantities. The first defines a responder; the second describes a difference in response probability. Neither, by itself, answers questions about durability, patient preferences or comparison with an active treatment.
3. Effect size, interval and p value
| Trial | Treatment | Placebo | Adjusted RD (pp) | 95.03% CI (pp) | p |
|---|---|---|---|---|---|
| SatraGO-1 | 49.0% | 31.2% | 17.9 | -1.6 / 37.3 | 0.0715 |
| SatraGO-2 | 52.9% | 23.4% | 28.9 | 11.5 / 46.2 | 0.0011 |
Active disease population, week 24. Published adjusted differences and 95.03% confidence intervals; the original confidence level is retained. Source: Briceño and colleagues, Ophthalmology. Published percentages may reflect estimation and missing-data procedures: multiplying them by a sample size does not recover participant counts.
The adjusted difference compares treatment minus placebo in percentage points; positive values favour response with treatment. Keeping the published estimator matters. Subtracting the rounded response percentages would give 17.8 or 29.5 points, rather than the reported adjusted differences of 17.9 and 28.9. An apparently small presentational change can therefore hide a switch between analyses.
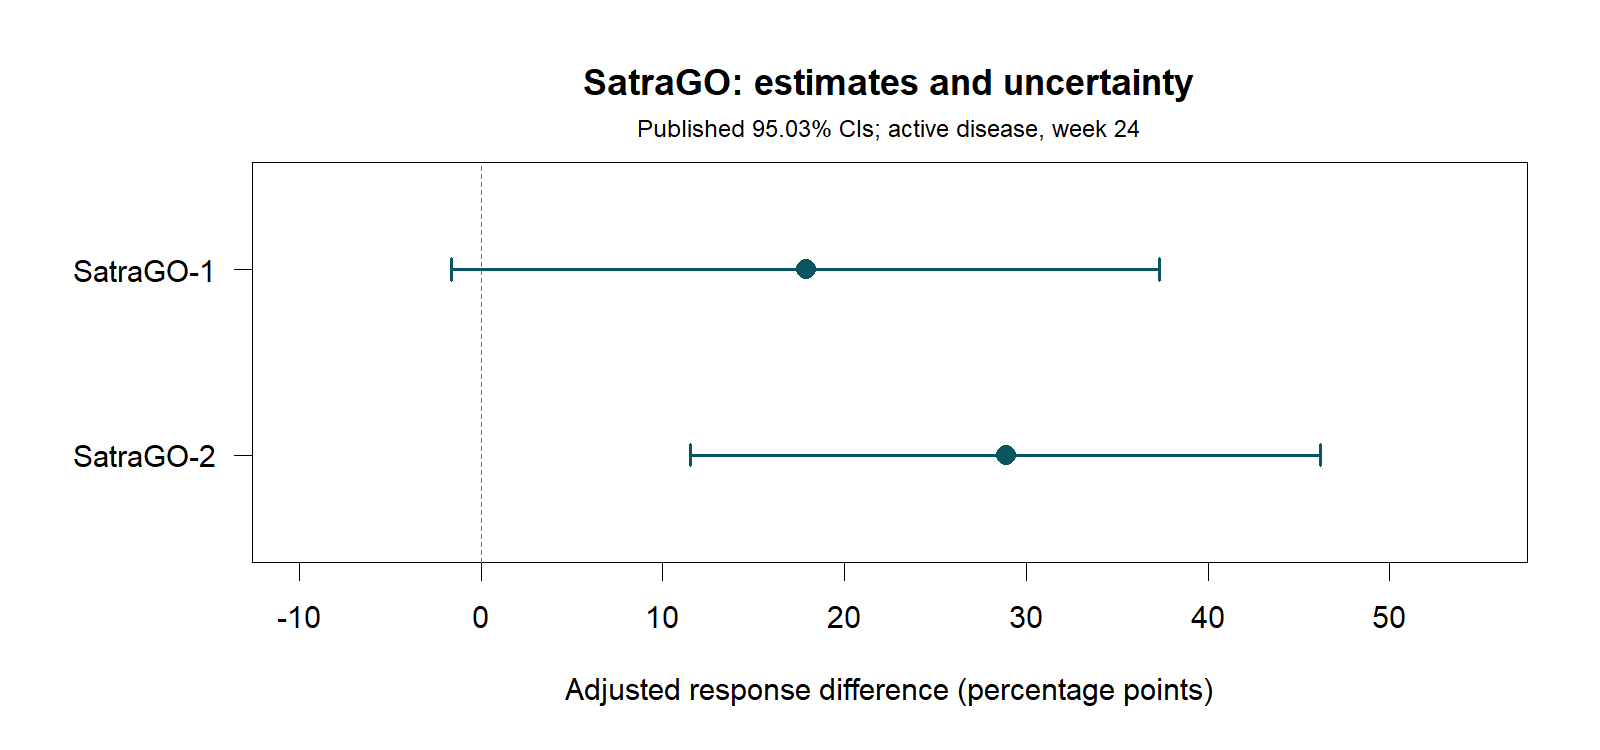
In the first study, the interval includes zero and substantial benefits. That does not mean an absence of effect has been demonstrated. In the second, the interval lies on the favourable side for this outcome and population, while considerable uncertainty about the magnitude remains. Both intervals deserve attention before the evidence is compressed into a single label.
A frequentist interval also does not assign a posterior probability of 95.03% to the true effect lying within these particular endpoints. Coverage describes the procedure's behaviour across repetitions under its assumptions. A clinical decision requires an additional question: which magnitudes would be sufficiently important, given the burdens, risks and alternatives?
4. Two p values do not test whether treatment effects differ
Each trial's test addresses its treatment-versus-placebo comparison. Comparing trials poses another hypothesis: whether the treatment effects differ. Knowing that one result passes a threshold and the other does not cannot settle that second question. This is the classic methodological warning discussed by Gelman and Stern.
The opposite shortcut would also be wrong: overlapping intervals do not establish equal effects. Visual overlap cannot replace a formal comparison, and failing to detect heterogeneity does not demonstrate equivalence. A suitable synthesis would examine compatibility of populations, outcomes, estimands and methods, alongside the statistical uncertainty.
Both the estimated treatment response and the placebo response differed between these studies. That observation is worth examining, but it does not identify a cause. It cannot automatically be attributed to centre selection, severity, adherence or measurement. Such explanations require specific evidence and analyses. Presenting them as established facts would turn reasonable hypotheses into unsupported conclusions.
A completely synthetic example
Imagine two independent estimates of a response difference: 12 percentage points with a standard error of 7, and 16 points with a standard error of 6. Under a normal approximation, the first has p≈0.086 and the second p≈0.0077. Yet their difference is 4 points with a standard error of approximately 9.22: p≈0.664. These numbers are invented to isolate the reasoning and have no numerical connection to SatraGO participants.
| Comparison | RD (pp) | 95% CI (pp) | p |
|---|---|---|---|
| Synthetic A | 12.0 | -1.7 / 25.7 | 0.0865 |
| Synthetic B | 16.0 | 4.2 / 27.8 | 0.0077 |
| B − A | 4.0 | -14.1 / 22.1 | 0.6644 |
This calculation assumes independent estimates. Estimates from overlapping participants or correlated comparisons would require the covariance. The example shows why separate labels cannot answer a joint comparison; it does not provide an alternative statistical analysis of the actual trials.
5. What should inform the next trial?
An observed response rate does not become a known future response probability. Before calculating a sample size, we must specify the population, the definition of response, the assessment time and a difference that would be both important and plausible. The sample size follows those decisions. A precise numerical answer can still rest on weak assumptions.
For a synthetic prospective example, assume a 25% response with control and 40% with treatment. Using Trial Planner's normal approximation, two-sided alpha 0.05, 90% target power and 1:1 allocation requires 203 usable outcomes per group. Common 90% retention leads to randomizing 226 per group, 452 in total. This does not reproduce SatraGO, which has its own analysis and trial structure.
The 15-point target difference is a teaching assumption, not a validated clinical threshold for thyroid eye disease. DELTA² guidance places justification of the target difference, informed by evidence and stakeholder involvement, at the centre of trial design. The most optimistic effect in a previous study rarely supplies an adequate justification on its own.
A useful next step is to examine a higher control response, a smaller benefit or more unavailable measurements. Holding an absolute difference fixed and holding a risk ratio fixed describe different alternatives. The choice must be explicit. Quietly changing it between scenarios makes the comparison difficult to interpret.
6. Estimands, missing data and multiplicity
SatraGO's methodological presentation describes Mantel–Haenszel weighting, stratification and multiple imputation under a missing-at-random assumption for the primary outcome. It also distinguishes strategies for intercurrent events. These decisions determine the comparison being estimated and the assumptions supporting it. A test of two aggregate proportions will not necessarily reproduce the reported estimate or uncertainty. Presented methods.
Stopping treatment and lacking an outcome measurement are related but distinct issues. An outcome can be measured after treatment discontinuation; a measurement can also be missing while treatment continues. The ICH E9(R1) framework helps specify the question before aligning data, analysis and sensitivity assessments. Increasing recruitment does not remove bias when missingness depends on unobserved outcomes.
The publication also explains that SatraGO-1's primary result prevented further formal testing of key secondary outcomes within its hierarchy. Selecting a secondary outcome with a small p value afterwards cannot restore a confirmatory conclusion. Nominal results can remain informative when clearly identified and interpreted within the multiplicity strategy.
7. Benefit, safety and applicability
The convenience of subcutaneous administration and improvement in an outcome are separate components of clinical value. The announcements report no new safety signals; that does not mean an absence of risks or establish superior safety over alternatives. Study size and duration constrain the characterization of uncommon events. US announcement.
Applicability requires asking whether a patient resembles the relevant study population and whether the outcome captures what matters to that person. We do not automatically extend the active-disease primary result to every disease form or duration. Nor can placebo-controlled studies alone establish an advantage over active treatments. Those questions require additional evidence and clinical judgement.
Keeping these questions visible makes the statistical discussion more useful. A large estimated response difference does not tell us how an individual patient will respond, while an uncertain estimate does not make every clinical scenario equally plausible. Decision-making should integrate the full evidence with the person's circumstances rather than asking a threshold to perform that work.
8. Practise with an explicit design question
The binary response planning guide develops the 25%-versus-40% example, a nine-scenario matrix, the cost of 2:1 allocation and the conceptual treatment of missing outcomes. It includes a standalone R script, synthetic CSV files and exercises with solutions. Educational results remain separate from the published clinical results throughout.
After working through it, readers should be able to justify their Trial Planner inputs, recognize when the method is too simple for their question and communicate a sample size together with its assumptions. That is a more useful research outcome than categorizing two trials only by their p values.